

How Would You Like To Lose Money In 2022
/How would you like to lose money in 2022? (Market Update)
Can the Fed Lower Interest Rates without causing a recession? 2022 has been filled with INFLATION, RISING INTEREST RATES and FEARS OF RECESSION. Within the last five months the S&P500 has declined by more than 15%, the Dow Jones over 10%, the NASDAQ tech-based growth index down over 25%.

Now let’s discuss why I worded this first paragraph in the way that I did. It enticed you to click on it and read more… This is not a new concept; the media makes money off of clicks and attention-grabbing headlines than ever before. Their goal is to scare, light a fire or entice you like never before. Now before we discuss the economics and actual statistical significance of the current market, I wanted to make one thing abundantly clear; IT PAYS TO BE A BEAR. How do I know this? Because I am willing to bet my first line caught your attention, and it wasn’t even mine, it was taken from the headline of a Wall Street Journal article:
“Sadness and anger, for example, are negative emotions, but anger is much more potent. "It drives us, fires us up, and compels us to take action," Harvey Berger [Founder and CEO of ARIAD Pharmaceuticals] says. If you've ever found yourself falling for outrage clickbait or spent time hate-reading and hate-watching something, you know what Berger is talking about. "Anger, anxiety, humor, excitement, inspiration, surprise—all of these are punchy emotions that clickbait headlines rely on," he says.”

Within the graph above we can see the majority of news coming from four of the major mainstream media news sources are overwhelmingly negative.
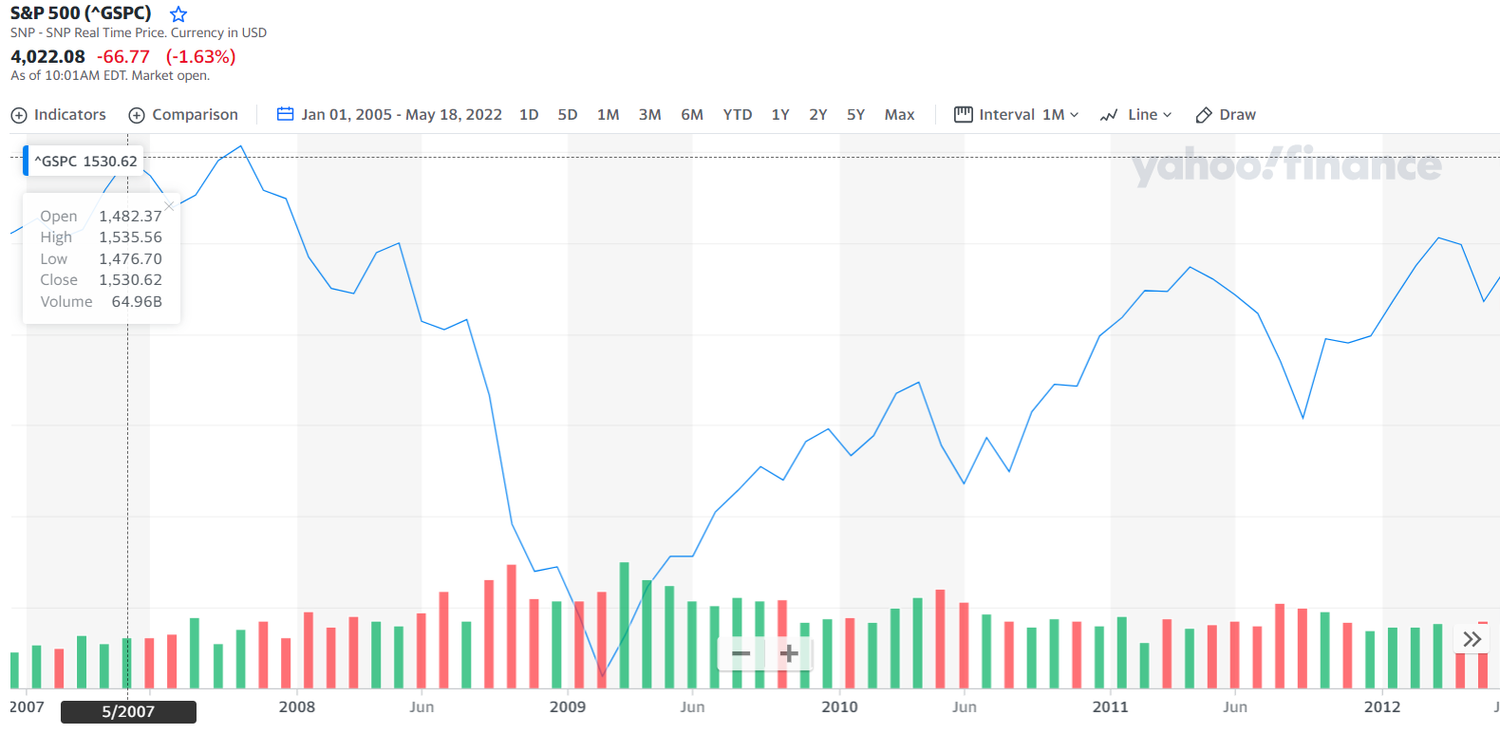
Now since we have discussed why the world wants you to think a crash is coming lets analytically look at what actually causes a market crash? By observing the history of the markets and highlight what causes markets to decline, we know, markets move (in the short term) most commonly because of buying and selling. Below I have taken a screenshot of the S&P500 from 2007 to 2013 to highlight the 2008 market crash. If you look to the bottom of the chart, you can see a handful of green and red columns. These are called candlesticks, and they represent the volume at which people are buying and selling stocks. Red candlesticks represent selling and green candlesticks represent buying. As you can see on the decline of the 2008 crash the majority of the candlesticks are red, this forces markets to a bottom before someone steps in and says “This is now so cheap enough where I am willing to buy.” That is what we see right at the very bottom of the 2008 trough. On a very simple scale this is an explanation to how the markets tend to move.
The upside to the current conditions we are in is the fact that quite literally... There is currently no alternative to equities. Or as we say, TINA (There is no alternative). Let’s look at what that means, the chart below depicts the amount of interest a consumer would earn with $100,000 in the bank throughout the last few decades. As you can see in the years prior to the 2008 financial crisis you could sell your stocks, put your money in the bank and still make 2-5%. (If you are under the age of 30 this is where you laugh audibly). At this moment the average bank account yields .04%. This Is not a very attractive when compared to stock investing. Not to mention we have an extreme surplus of cash in the system. The average American has more money in the bank than ever before in history. So, mix this all together, we have limited opportunities outside of stock investing (stopping a major selloff) as well as a surplus of cash to potentially fuel the market with buyers.

What we have experienced thus far in 2022 is not a rare occurrence, we actually have seen this dozens of times throughout history. At some point in the year the market has pulled back negatively and still ended the year positive. In the illustration below the lowest point the market hit during a specific year is denoted by a red dot and the grey bar denotes where the market finished in that given year. There are 16 examples just in this illustration where we see a double-digit decline and by the end of the year the market is positive.

Now what you may be thinking is “This time is different.” That phrase has been uttered for hundreds of years through hundreds of economic cycles. The fact of the matter should be, it does not totally matter if it is or isn’t. The market has proven one thing time and time again, the most patient investors are the ones who are rewarded with the greatest success. Tune out the noise, and let the beauty of “time in the market” not “timing the market” do what it does best.
The four most dangerous words in investing are
“This time is different”
- Sir John Templeton (1933)