
Inflation Is MUCH Lower Than You Think
/The media and the average person misunderstand and misinterpret inflation for two important reasons:
They focus on the ANNUAL reported inflation number which tells you what has happened over the past year but not where inflation is headed.
The SHELTER component of inflation which measures rents and home prices makes up about one third of overall inflation but lags real-time housing data by up to 12 months.
The most recent inflation report that was published on 12/13/2022 makes an excellent illustration of these two points. Understanding the nuance of inflation reports and where we are headed rather than where we have been is key for setting expectations for how much further and how quickly the Fed will continue to raise interest rates as well as how long rates will remain elevated.
Annual CPI (consumer price index) tells us how much prices have gone up over the past year as a whole.
This is the figure most often reported by the media. As shown in the line chart below, this figure peaked in June of 2022 at just over 9% and has been trending downward ever since to its current level of 7.1% (as of November 2022). This annual figure is calculated by taking all of the monthly increases for the past year (each of the bars in the bar chart below) and adding them together. For example, if you take all of the bars in the bar chart and add them together, you get that 7.1% current ANNUAL inflation.
This is great for telling us what happened over the past 12 months, but it’s a very bad way to measure what is happening right now. On the way up, the annual figure lags the real-time situation making it harder to see inflation heating up, and on the way down it lags the real-time situation making it hard to see inflation cooling down. Later we’ll see how the lag in rent and home price data makes this problem even worse.
A better way to understand what is happening right now is to ignore the ANNUAL number and instead ANNUALIZE the most recent 3-6 months of data. A couple of examples. If you take the most recent 6 months of data (June through November) you get a 4.5% annualized inflation rate. That’s much lower than the 7.1% figure for the past 12 months. If you take 5 months of inflation data (July through November) you get a 2.4% annual inflation rate. If you take the last 3 months of data you get a 3.6% annualized rate. These examples tell us that for the past 3 to 6 months we have been MUCH closer to the Feds official target of 2% annual inflation than most people believe.
It works the other way too - if you had taken the last four months of data when inflation peaked in June, you would have had an annualized inflation rate of 11.4%! This is much higher than the reported 9.1% annual figure.
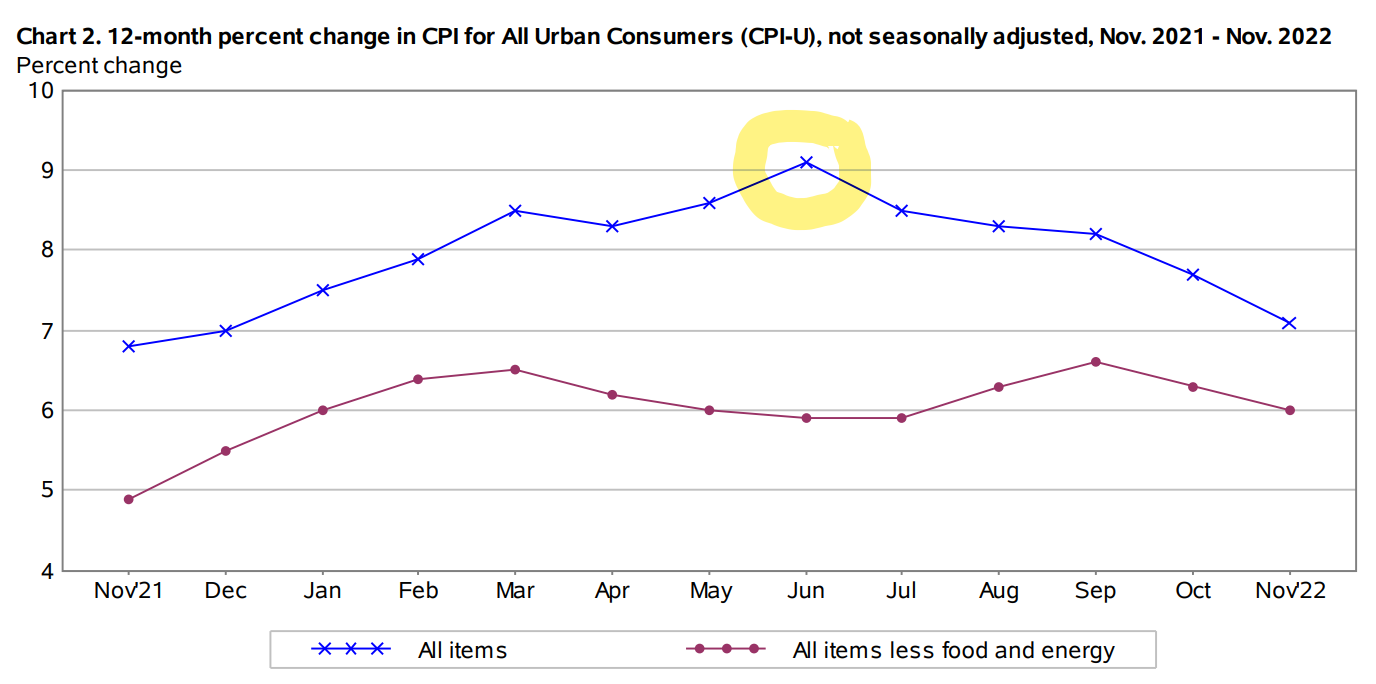
Chart of annual cpi from bls cpi bulletin december 2022

chart of monthly cpi from bls cpi bulletin december 2022
Looking through this lens and understanding how annual inflation data lags what is happening right now shifts the narrative surrounding inflation. It didn’t just burst onto the scene a year ago and it hasn’t remained “stubbornly high” as the Fed has taken measures to push it back down to an acceptable range. According to the data, what actually happened was:
Inflation accelerated quickly as our economy reopened following the pandemic, particularly after the vaccine rollout in early 2021. The 3 month annualized rate (red line below) reached its first peak at 9.2% in June of 2021 while the annual rate that is broadly reported (blue line below) had just surpassed 5%. The Fed and many economists believed inflation would be transitory and inflation was not yet a “mainstream” topic.
Inflation remained elevated through it’s eventual peak in June 2022 but it wasn’t resisting the Fed’s efforts, the Fed just wasn’t doing anything. As the annual inflation rate caught up to the 3-month figure and gas prices spiked in January 2022, inflation became a hot mainstream topic (as evidenced by google search data).
As the Fed began to raise interest rates (yellow line below) in earnest with it’s first 0.75% increase in July 2022, the 3-month annualized inflation rate plunged into the range of 3% to 4% while the annual rate has lagged substantially in the 8% to 9% range. Ignoring this dramatic near-term decline and focusing on the much higher annual number would lead you to believe the Fed has “a lot of work left to do” when in reality the work may be nearly finished and the (lagged) data just hasn’t caught up yet.

chart was created using data from bls cpi bulletins dec 2018 - dec 2022, fed funds rate data from st louis fed
Home and rent prices accounts for a massive one third of CPI - but the way they are measured lags reality by UP TO 12 MONTHS
This is according to a paper written by the Bureau of Labor Statistics in conjunction with the Cleveland Federal Reserve Bank. An excerpt from their paper explains how large of an impact this has and why it’s such a big deal:
“Shelter is by far the largest component of the Consumer Price Index (CPI), accounting for 32 percent of the index. Accurate inflation measurement therefore depends critically on accurate rent inflation measurement, which is the primary input to both tenant and owner equivalent rent. It is therefore concerning that rent indices differ so greatly. For example, in 2022 q1 inflation rates in the Zillow Observed Rent Index (ZORI; see Clark (2020)) and the Marginal Rent Index (Ambrose et al. (2022)) reached an annualized 15 percent and 12 percent, respectively, while the official CPI for rent read 5.5 percent. If the Zillow reading were to replace the official rent measure in the CPI, then the 12- month headline May 2022 CPI reading of 8.6 percent would have read more than 3 percentage points higher.” (emphasis mine)
As the authors explain, if CPI had accurately reflected real-time data on home and rent prices, inflation would have peaked near 12%! Piling this huge lag for such a major component of CPI on top of a focus on the annual vs. near-term inflation rate puts policy makers and investors very out of sync with economic reality. Had the Fed paid more attention to the shorter-term trend and real-time data on rent and home prices sky-rocketing in the spring of 2021, they may have moved to raise interest rates 6 to 9 months sooner and curbed inflation at a rate of 5% to 6% rather than the near 10% rate we ultimately suffered.
This home and rent price lag is now working in reverse to create the illusion of higher inflation.

chart from st louis “Fred” website - data is published with a lag - sep 2022 most recent reported
Taking the principle above and applying it to our current situation, the rent & home price component of CPI today largely reflects the economic condition one year ago. At that time, the Fed had not even begun to increase rates and the average 30 year mortgage was around 3%. From June of 2021 through June of 2022, US home prices shot up by nearly 20% per the Case Schiller Index. That massive increase (which in reality happened in the past) will continue to feed through into CPI data making the rate of inflation look much higher than it really is. The reality is that From June 2022 through September 2022, home prices dropped by 2.6% or an annualized rate of 10.4% (September is the most recent data published by the Fed - the irony of this lag is not lost on me). So while home prices in reality are dropping, CPI data will continue to show robust price increases for its hugely important “shelter” component.
If you adjust the annualized 3-month inflation rate using CURRENT home price data, you see that inflation has slowed much more than official CPI data indicates.
If you replace the high growth rates the official CPI data use with zero growth in home prices over the past 3 months, the 3.6% annualized CPI rate we discussed earlier drops to just 0.85%. If you include the drop in home prices that the Case Schiller Index shows, the 3 month annualized rate of inflation drops even further to 0.2%! Both of these are well below the Fed’s target inflation rate of 2%.
Even if you strip out the recent price decreases for gas, energy, and used cars… without the lagged shelter component you’re still at just a 2.4% annualized inflation rate. All of this tells us that while some contributors to inflation like food, transportation, and some service industries may prove stickier and harder to bring back below 2%, if the current trend continues and no major geopolitical event occurs REAL inflation (ignoring that pesky lagged real estate component) is likely to remain in the 2% to 4% range.
The economists at the Fed aren’t stupid, they’re aware of the lag and impact of the real estate component. Heck, their own team wrote a paper on it! This should mean they factor it into their policy decisions and look through the noise in the data to the REAL economy. If they do, I’d expect the upcoming 0.5% increase to be the last large hike with the “final” rate topping out around 4.5%. Coincidentally, this is what the bond market is also predicting based on the current yield curve (12/13/2022).
MORE TO COME - I’ll be following this post shortly with another breaking down what this could mean for stock and bond markets in the coming year. In the meantime, I hope you enjoyed this trip down the rabbit hole of Inflation and CPI. Always remember, the media is a business. They are out for clicks and traffic, not to educate you. Scary headlines and political narrative sell. I encourage everyone to seek out the data and let it speak for itself or rely on trusted advisors who do the digging for you.


Footnotes
All CPI data is from official Bureau of Labor Statistics bulletins
Case Schiller home price data and Fed funds rate data is from the St. Louis Federal Reserve website
My own calculations of annualized data modified by adding/removing/adjusting specific components is based on archived CPI bulletins published by the Bureau of Labor Statistics from 2018 through November 2022.
Current 3-month and 6-month annualized calculations were based on the November 2022 bulletin detailed categories data from the BLS.